








Watching VICIdial capacity when sys_perf_log is off
The server_performance table is empty on a stock VICIdial box. What turns it on, what it costs to wait, and which other tables give a capacity picture today.

To the point
On a stock VICIdial server servers.sys_perf_log is N, so the server_performance table is empty and you have no history of load. Turn it on, and meanwhile build a capacity picture from tables that are already filled.
- When enabled, the table gets a row about every 5 seconds per server.
AST_update.plreads the flag only at start, so a restart is needed. The keepalive relaunches it in about a minute.- A stock ViciBox 12 allows 23 trunks. If
local_trunk_shortagemoves, that limit was the cap. - We did not measure the logging overhead.
What the log holds
With the flag on, server_performance records load, active channels, SIP clients, live recordings and the CPU split. That turns "the box feels slow at peak" into a number you can divide. Off, any capacity figure you quote is an estimate.
AST_update.pl writes it and reads the flag once, when it starts. Changing the field does nothing to a running process. The restart interrupts the screen that keeps server and agent status moving, so do it when no call is up, not at the start of a shift.
Turn it on, step by step
Real screens from our test server. A numbered marker on each screenshot maps to the list under it.
In VICIdial's admin

- System Performance: set it to
Y, then click SUBMIT at the bottom. Wait about a minute for the restart.

- Max Trunks: the cap on simultaneous lines for the entire box. A fresh ViciBox 12 has 23.
- Max Calls per Second: how fast new calls start.
In the Trustane console
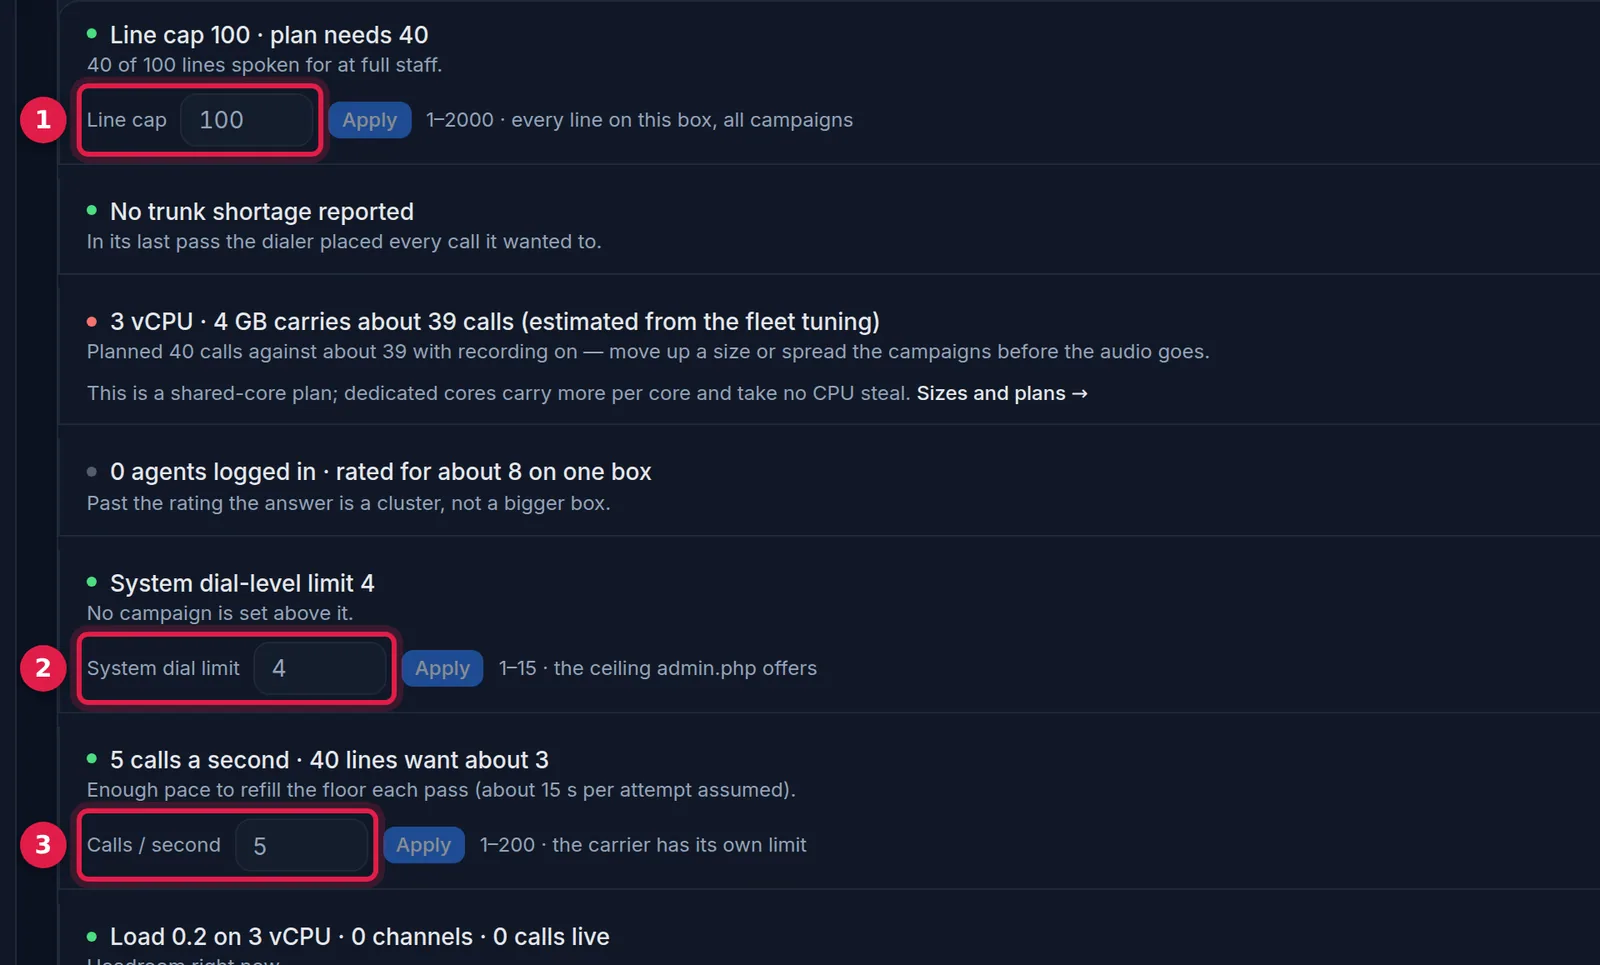
- Line cap: the trunk limit, read from the server. Change it here and press Apply.
- System dial limit: the dial level choices the admin screen offers. The dialer scripts do not read it.
- Calls / second: the rate at which calls are started.
What to read before the log has data
Four sources already describe a lot.
Call history gives demand. vicidial_log has a start time and length for every call. Sweeping them minute by minute gives concurrent calls. On a call history of about 1.1 million calls:

The second busiest day peaked at 60 calls with 23 agents, and the average call lasted 18 to 19 seconds. The sweep counts only calls that connected and have a length, so it understates lines still ringing. The conclusion is in lines per agent.
Trunk shortage gives the limit that bound.
SELECT campaign_id, SUM(local_trunk_shortage) AS short
FROM vicidial_campaign_server_stats GROUP BY campaign_id;
If this counter moves, max_vicidial_trunks was the cap and CPU is not the issue. The value is re-read about every 25 seconds, so changes are live.
Live channels give a spot reading. Run asterisk -rx 'core show channels count' at peak. Asterisk counts two channels per bridged call, so halve it. Crude, but real.
Agents give the multiplier. vicidial_live_agents by status shows READY, INCALL and PAUSED. The dialer's goal is the dial level times the agents it counts.
Reading the results once it has data
Wait for 100 or more samples with a peak of at least 20 channels. Then:
- List
server_performanceby hour for a week. Find the peak channels and the CPU then. - Divide the CPU rise above idle by the peak channels. That is the cost per channel.
- Divide a planned ceiling (we use 70 percent CPU) by that cost.
- Compare with
max_vicidial_trunks. The lower number is your limit. - Repeat after any change to recording, codec or AMD.
Disk and memory need their own look. server_performance does not replace free, iostat or a disk alert.
What can mislead the numbers
- A quiet week. It gives a flattering cost per channel. Use your busiest week.
- Other work. A report, a lead load or a backup inflates CPU. Discard those times.
- Shared CPU. A neighbor you cannot see changes the cost. Treat the result as a range.
We did not validate the method against a server pushed to failure. It is a planning formula, not a substitute for a load test.
Questions people ask
Will turning it on slow the dialer?
We did not measure it. It is a small insert every few seconds and we have no evidence it matters, but we give no number.
Do I need the log to know my line limit?
No. max_vicidial_trunks and the local_trunk_shortage counter show the cap today.
Next steps
Run SELECT server_ip, sys_perf_log FROM servers;, turn it on at a quiet hour, and leave it for a full busy week. Meanwhile run the shortage query. For a server sized and watched for you, see VICIdial hosting, pricing or the wallboard.
VICIdial is a trademark of its owner. Trustane is an independent hosting provider.
Sources
- Trustane capacity findings, read from AST_update.pl and the dialer tables
- Trustane floor report, the trunk short counter
- Cover photo by panumas nikhomkhai on Pexels
Managed VICIdial hosting